
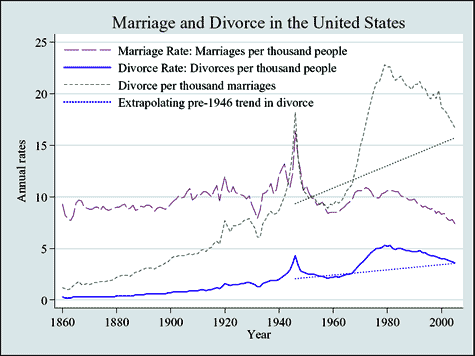
I think this graph, from an upcoming paper in The Journal of Economic Perspectives ((“Marriage and Divorce: Changes and their Driving Forces,” by Betsey Stevenson and Justin Wolfers, The Journal of Economic Perspectives, Winter 2007. Pdf link to paper.)), is interesting.
There’s a “sky is falling” mentality among many so-called marriage advocates. According to their storyline, marriage in America had a golden past until the culturally permissive 60s and 70s, during which drug addicted and probably communistic social scientists convinced legislators to pass no-fault divorce laws, after which divorce rates shot up as parents abandoned their tow-headed big-eyed children to go inhale the demon weed with Abbie Hoffman while having loose and quite possibly lesbian sex with Janis Joplin on top of a LSD-themed painted car while hairy-legged feminists kick men out of the home creating the fatherlessness crisis which has led to the trifecta of evil: skyrocketing divorce rates, Janet Jackson’s nipple ring, hip-hop music.
I never hear any of the divorce chicken littles talk about divorce in non-apocalyptic terms; in their narrative, things are always getting worse. But it’s not the sky that’s been falling since the 1970s – it’s the divorce rate. And to blame divorce on gay marriage – when divorce has been dropping like George Bush’s approval ratings for as long as same-sex marriage has been on the national agenda – is lunacy. On the other hand, marriage rates have been falling.
The dotted lines on the graph show where the century-old divorce trend would have been if not for the recent rise and fall. The question is, will divorce rates return to their long-established slow rise, or will the current fall in divorce rates continue? ((Or it could always level out, I guess, or do any number of inbetween choices.))
More on divorce in future posts – including a post on that most unjustly framed institution, no-fault divorce. No-fault didn’t cause rising divorce rates in the 60s and 70s; if anything, it was the other way around. Plus, the rise of one great American institution and the fall of another: birth control and shotgun marriages. Woot!

Pingback: Dr. Melissa Clouthier
Pingback: dangerousmeta!
I’m less interested in the return to the trendline than the departures from it. There were notable spikes in both marriage and divorce rates at the ends of the two world wars, and a trough at the time of the great depression, but what caused the explosion in the divorce rate between 1960 and 1980?
But…but…single mothers! And welfare! Negroes in our schools!
This is a fine post- it both shows why some people believe what they do (it is a well-founded observation to say that divorce is on the rise) but also a little bit of the truth behind it (this is cyclical, and it is more valuable to think about other factors than it is to consider this to be a new dark age.)
I think it’s interesting that the marriage rate looks like it’s had wilder variations than the divorce rate, actually… especially pre-1940.
Hairy-legged man-hating feminists, of course! ;)
Amp: That first satirical paragraph was so perfectly written it almost (really!) made me spit coffee on my monitor I was laughing so hard. Genius.
Sailorman:
Hairy-legged man-hating feminists, of course! ;)
I could forgive them that. I could even forgive them Janet Jackson’s nipple ring. But if it turns out that they’re responsible for hip-hop music…
I don’t think this proves what you say it does.
The graph shows that the marriage rate is converging onto the divorce rate. That does look alarming. That means more marriages end in divorce each year. By my eyes your graph shows it was 5/10 (50%) somewhere in the 80s, and we’re approching 4/7 (57%) today.
The fact that the divorce rate is falling in absolute numbers per 1000 people looks like a function of the falling marriage rate per 1000 people. For obvious reasons those two trends are linked. ;)
Neil K said, “The graph shows that the marriage rate is converging onto the divorce rate. That does look alarming. That means more marriages end in divorce each year. By my eyes your graph shows it was 5/10 (50%) somewhere in the 80s, and we’re approching 4/7 (57%) today.”
Those stats cannot be determined from that graph. All these rates (per 1000) track are the number of marriages and divorces in a given year, but we cannot assume that those are the same people getting married or divorced. Moreover since these are rates you should noted that the y-axis of the graph only goes to 25 per 1000.
The truth of the matter is that 50% of all marriages will end in divorce figure that is commonly cited is most likely inaccurate. We don’t really know how many marriages today will end in divorce tomorrow. In the random sample surveys I have seen, the number of divorced people is somewhere between 10-30%, but random samples include people who have never been married in the first place. My personal guess based on my own background as a family researcher is that the figure of marriages that end in divorce is probably considerably lower than 50%.
Neil K said, “The fact that the divorce rate is falling in absolute numbers per 1000 people looks like a function of the falling marriage rate per 1000 people.”
No, not really because these are rates. They are not absolute numbers. It certainly stand to reason that fewer people are getting divorced because the marriage rate is down, but there are probably more marriages today in absolute numbers than there were in 1860 because the population is about 3Xs more people.
Rachel, I’m having more than a little trouble undersatanding your reply.
It’s true we have no way of knowing from that graph which couples are getting divorced. But the graph does, nonetheless, suggest a conclusion that a higher percentage of all marriages are ending in divorce. You can see that fairly easily by the “divorce per thousand marriages” section. It also, incidentally, means that there’s a larger absolute number of divorces yearly, as 1) the divorce rate is going up, and 2) population is climbing.
(I don’t mind the axis issue so much here, because it’s a relative comparison between two things on the same graph and is not as misleading.)
This statement is sort of meaningless without more detail. Inaccurate by how much? What other number would you suggest? Without an alternate from which to choose, I’m not sure what your “most likely inaccurate” comment is supposed to say. I agree that the chances of it being exactly 50% are exceedingly small.
No, of course not. We cannot predict the future with perfection.
We can make aneducated guess, though, based on the existing statistics. We can make an even “better” educated guess if we are open about our assumptions: “if current trends continue, we would expect _____” Are you suggesting we should never make future predictions based on current trends? If not, what do you mean by this sentence?
OK. It sounds like those studies are inapposite so I won’t respond to them.
Because of your studies, I KNOW you’re not expecting reliance on your anecdotes in this respect. If you’re a family researcher, can you provide studies/statistics that support your statement? And can you suggest what “considerably lower” means in your statement? 47%? 45%? 20%?
Actually, I am pretty sure Neil is right here. Over the long term, the divorce rate per unit of population is limited (for obvious reasons) by the marriage rate per unit of population. You have to get married before you can get divorced.
Yes, there can be smaller blips where divorce can exceed marriage because people can divorce who were married earlier–but in a population dynamics sense, they are linked. Nick used the word “absolute” which sort of confused the issue, but he used it in the context of a rate.
There is only one measure of divorce shown here which is independent of the rate of marriage per unit of population. That measure is the “divorce rate per thousand marriages which is reflected on the chart.
Reducing the marriage rate per unit of population will, all other factors being equal, reduce the divorce rate per unit of population. It will not necessarily reduce the divorce rate per 1000 marriages.
I completely agree. The absolute numbers (not a rate) of both marriage and divorce have gone way up because of population increases.
The fifty percent figure comes from the dividing the actual number of marriages in a given year by the actual number of divorces in a given year. So if there were 50 marriages and 25 divorces in 1985, somebody decided that this meant we had a 50% divorce rate. The problem with that figure is the majority of the people divorcing are not the same people who got married in that year.
A better (but difficult method) of tracking divorce rates is by following a cohort over time and tracking who gets divorced. There is a statistical technique called hazard modeling (which I have never used, since i do qualitative research), where you could get actual likelihood ratios.
some big problems in this analysis unless it only exists to debunk ‘conservatism’. For example, divorce rates are down because marriage and fertility rates are down. Is that good? It just means fewer people fail because fewer people try. If marriage is bad, that’s good, if it’s good, then that’s bad.
You have to assume some unspoken premises here. If your ‘good’ is personal freedom, then this is probably good. people have more choices and there are more ‘scripts’ made possible by birth control, co-habitation, no fault divorce, abortion and so on. This should naturally make the percentages of marriages that break fewer, since those marrying are more given to the arrangement. But that doesn’t mean we are becoming a more stable, committing and familialy and civicly self-sufficient society. It equates to much more single parenting, and therefore childhood and female poverty, fewer younger men in the workforce and a fertility rate that is below replacement (2.2), meaning racial and cultural extinction.
If you’re after ‘social capital’- the ability of families and communities to take care of themselves without a welfare state (needed in both the Liberal and Conservative social vision), then this is all quite bad. And it is especially bad for the disadvantaged when you break it down socioeconomically- marriage rates are still 85% among the new upper class and only 45-48% (i can’t remember) among the new lower classes. these family scripts are feeding into major and long term class divisions that had not existed previously in America- leading to Liberally abhorrent income inequalities that will last for generations.
If you just want to attack conservative religious people by means of persuasion, then this is a clever post, but if you’re trying to demonstrate that these realities are good for either a conservative or liberal moral vision- I think this post missed what these studies really tell us.
Pingback: Quora
Pingback: Divorce Rate in United States of America | DivorceRate.com – Divorce Rate & Statistics